
Network Monitoring Software for Your Enterprise
Product Visualization
Overview
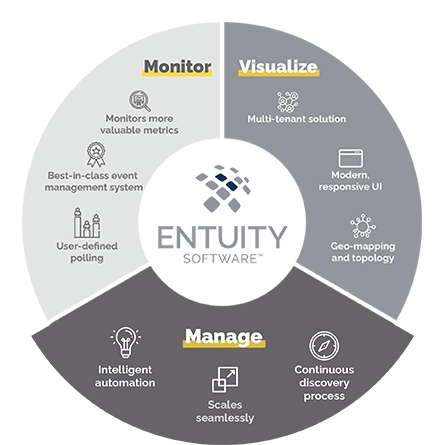
Designed for today’s multi-vendor networks, Entuity Software™ enables NetOps teams to more efficiently and effectively monitor, visualize, and manage their networks.
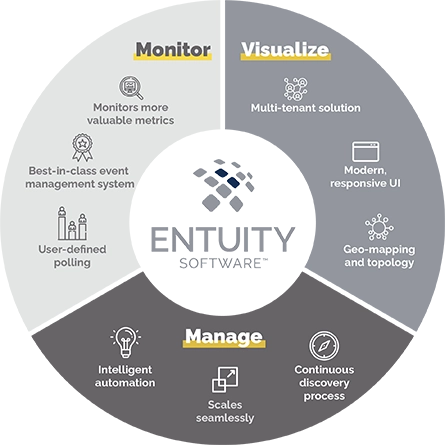
Monitor
- Monitor more valuable network metrics
- Supports thousands of devices, from hundreds of vendors out-of-the-box (including any SNMP-compliant device)
- Intelligent event management system
- Extend beyond standard monitoring with user-defined polling
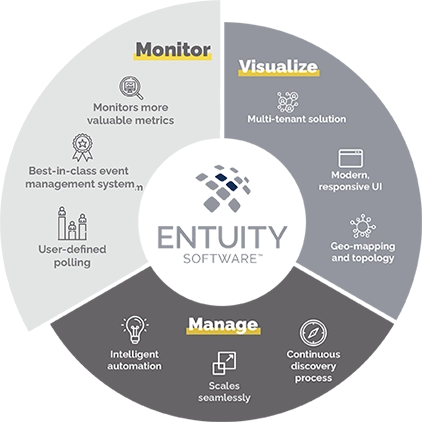
Visualize
- Modern, responsive user interface
- Dynamic network topology and geographic maps
- Custom report builder plus over 100 out-of-the box reports
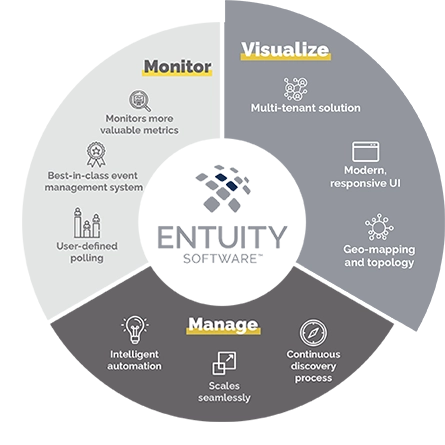
Manage
- Automated network discovery proactively adds and configures devices
- Configuration monitoring and management
- Intelligent automation
- Federated architecture for seamless expansion
- Support multi-tenancy to simplify management of multiple stakeholder event metrics
Product Tour
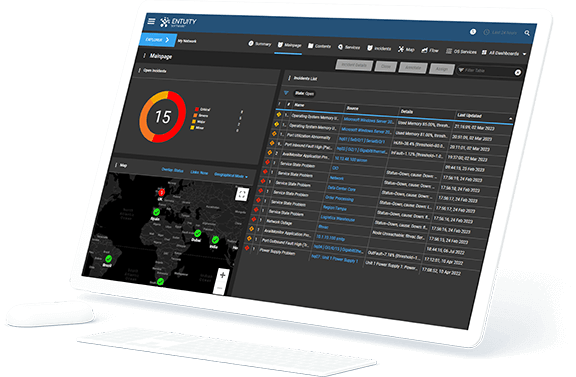
See Entuity Network Monitoring Software in Action
Sure, dynamic network topology mapping and a modern, responsive user interface sound great – but they look even better! Check out our short product tour to see Entuity Software™ in action.
Product Function Overview
See more network discovery software details.
See more network topology mapping software details.
See more network fault management software details.
See more network flow analysis software details.
See more network path analysis software details.
See more details about Entuity IP Address Management here.
Entuity Network Monitoring Use Cases
Vendor agnostic network discovery and monitoring
Troubleshooting and problem resolution
Capacity planning and optimization
Service level agreement (SLA) monitoring
Integrations
Identifying network issues causing SaaS application intermittent slow response
Diagnosing an overloaded WAN link
Entuity Features
| Supports thousands of devices, from hundreds of vendors out of the box |
| Support for SDX platforms |
| Configuration management and monitoring |
| Automate NetOps tasks |
| Infrastructure support – server/storage/cloud |
| Integration options with Park Place services |
Recognized as Leader in Network Monitoring & Management by G2
How We Compare with Other Network Monitoring Software
Direct Access to our Solutions Architects
Our Tech Talks allow Entuity users firsthand access to our Solutions Architects. These regularly-scheduled, interactive sessions include details on new features and ideas for getting the most out of the enterprise network performance monitoring software. Check out some of the previous Talks, it’s a great way to get a feel for our community.
Licensing Architecture
Licensing Types by Device
Pool of license credits that covers all other fully managed devices (controllers, VM platforms and hypervisors, servers, and storage assets) not covered by Associated Device/Item and Basic Device credits.
- Auto Discovery
- Asset & License Management
- Auto Topology/Geographic Maps
- Performance Monitoring
- Event Management
- Basic Flow Monitoring
- Root Cause Analysis
- Service Level Monitoring
- Virtualization & Server
- VoIP & Network Quality (IP SLA)
- Reporting
- Virtualization Management
- User Defined Polling
- Customizable Dashboards
- NBAR Support
- IP SLA Support
- Cisco Unified Comm Manager (CUCM)
- Quality of Service Monitor
- Cisco ACI
- Wireless
- VPN Monitoring
- Multi-Cloud Support
- Server Monitoring
- Storage Monitoring
- Third-Party Integrations
- Restful API
- Detailed Reporting
Pool of license credits that covers ping-only and basic managed devices. There are two types of management for basic devices:
- Ping Only-checks for status via IMP
- SNMP-polls the following metrics (but does not include any port data):
- ICMP reachability % (including Down %, Uninitialized % and OK %)
- Name (including Display Name)
- Polled IP address
- MAC address
- Location
- SNMP type
- SysOID
- Cisco Meraki (including routers, switches, APs etc)
- Cisco Viptela (including devices from the vManage platform)
- VMWare ESXi (VMs)
- Microsoft Hyper-V (VMs)
- Amazon Web Services (VMs)
- Microsoft Azure (VMs)
- Aruba Wireless Controllers (APs)
- Cisco Wireless Controllers (APs)
-
Configuration Management
Pool of license credits that covers both Configuration Management and Configuration Monitoring-charged by device.
-
Integrated Flow Analyzer Premium
Integrated Flow Analyzer Premium is an enterprise level license. Once purchased it can be used across all servers and devices.
-
SurePath Network Monitoring
SurePath is licensed per path with a maximum of 100 paths per Agent.
Product Features
Consumption Models
On-Prem Perpetual
On-Prem Subscription
Managed-Service
Entuity Basic Device License
Licensed by Device
Entuity Associated Device Item License
Licensed by Device / Item
Entuity Full Device License
Licensed by Device
Entuity Configuration Management
Licensed by Device
Entuity Integrated Flow Analyzer Premium
Licensed by Enterprise
Entuity Surepath - Network Path Analysis
Licensed by Network Path
Schedule a Demo
Gain at-a-glance visibility into how Entuity™, from Park Place Technologies, can assist you with enterprise monitoring and management of your server, storage and network infrastructure. This highly acclaimed tool can help you make accurate and faster decisions that keep your infrastructure and network running at peak performance.
Schedule your demo today and learn how Entuity can empower your IT team and budget.
Network Management and Monitoring Blogs

-
Michael Wardale
Network Mapping – How to Map a Network for Your Enterprise
Network mapping is essential for your business productivity. It gives network administrators important insights on traffic metrics, device status, physical/ logical connections, and more. In addition, it helps your business streamline network troubleshooting and maximize uptime. Jump-to Section What Is Network Mapping? Network Topology Mapping…
-
John Diamond
What Is DHCP in Networking? – How DHCP Works & Benefits
DHCP streamlines network management and assures effective IP address use by automating IP assignment and network configuration. This makes it simpler to handle changes in device connection and network architecture by enabling flexible and scalable control of network resources. Jump-to Section What is Dynamic Host…
-
John Diamond
What Is IPAM in Networking? – IP Address Management Technical Overview
There is a “multitude of separate resources” that are juggled when managing an IT environment. These resources range from equipment deployed to ports or interfaces. For example, ethernet switches to end user workstations. Ports need to be monitored to stay within capacity. Bandwidth is another…
-
Michael Wardale
Network Traffic Analysis – Methods and How to Analyze
Networks are built to handle traffic, but not all network activity is the same. It’s important to be able to identify security issues, as well as irregular operations that might lead to problems and even network downtime. Jump-to Section What Is Network Traffic Analysis? Benefits…
-
Jordan MacPherson
SNMPv1 vs. V2c vs. V3 – SNMP Versions Comparison
Once upon a time, there was a single version of the Simple Network Management Protocol (SNMP). It was used to monitor and manage all network devices, and those devices used it to communicate with one another. However, over time, different SNMP versions have arisen. Today,…
-
Susan George
Network Availability vs. Uptime vs. Downtime Meanings
Your network and IT assets should be available around the clock. Whether we’re talking about a corporate website or server-hosted in-house resources, accessibility is a critical consideration. Of course, disruptions and network downtime do occur, and organizations need to measure outages, outage types, and overall…
-
Susan George
Network Tools Consolidation Best Practices for Enterprise IT
Network management tools have proliferated right along with other technologies. As we run full-tilt into the age of AI and machine learning, more and more enterprises find themselves saddled with more network management tools than they can reasonably handle – up to 25 in some…
-
Susan George
What Is Network Observability (vs. Monitoring)? – Observability Use Cases
When you think about your network, chances are good you imagine servers and routers, switches, and firewalls. However, what about its internal state? What bottlenecks are occurring and where? Where is demand from users growing and where is it fading? What resources are being stretched…
-
Jordan MacPherson
What Is Network Automation? — How It Works and Its Benefits
You roll into work on Monday morning after a relaxing weekend – life is good! After checking your network status, you move onto your email and your stomach drops. Your company just completed a new acquisition, and you need to update network configurations for thousands…
-
Jordan MacPherson
What Is Network Optimization? – 5 Techniques and Solutions
The importance of network performance cannot be overemphasized. A reliable, efficient network can reduce the stress of your day-to-day duties, help you focus more on strategic IT initiatives with your team, and avoid those 2 a.m. network failure calls that could ruin your week (or…
-
Jack Kauter
Choosing Layer 2 vs. Layer 3 Switches for Your Network Configuration
Jack Kauter and Park Place Technologies Network Engineer, Randall Greer, discuss a question from Abbotsford Police Department about whether to use layer 2 vs. layer 3 inter-switch links between the distribution and access layer switches of their network in this month’s Ask the Engineer. …
-
Jordan MacPherson
MTTR vs. MTBF vs. MTTD vs. MTTF Failure Metrics
You’re awoken in the middle of the night by your phone loudly ringing. The screen shows 1:37am, and the CTO is calling. Your network is down, and the nighttime skeleton crew hasn’t been able to pinpoint why. The next 72 hours are a whirlwind, and…
-
Jack Kauter
Using Netflow vs. SNMP for Network Monitoring [Ask the Engineer]
Jack Kauter and Park Place Technologies engineer, John Diamond, discuss using NetFlow vs. SNMP for network monitoring, and the merits of each protocol. SNMP vs. NetFlow Video Script The following script breaks down the difference between these two common types of network management protocol. Jack:…
-
Jordan MacPherson
What Is Network Capacity Planning? – Best Practices for Capacity Management
Jump-to Outline What Is Network Capacity Planning? How ITIL Defines Capacity Management Capacity Planning vs. Capacity Management Benefits of Capacity Management in IT KPIs for Network Capacity and Performance Management Network Capacity Planning Best Practices How Do You Determine Server Capacity? Benchmark Current and Forecast…